In “High Fidelity”, Rob Gordon asks the profound question: “Did I listen to pop music because I was miserable, or was I miserable because I listened to pop music?” The same chicken-and-egg logic applies to film box office performance: are films successful because we buy tickets, or do we buy tickets because films are successful?
Here’s a graph that supports the second claim – we buy more tickets when a film is successful, or in other words: success drives even more success:

If tickets were bought based solely on each individual’s personal and isolated taste preferences – we would have expected this plot to be linear – meaning box office would increase proportionately with rank. But this plot is clearly non-linear. It looks logarithmic.
So it seems that film box office has a recursive nature, where success drives even more success in a positive feedback mechanism: the difference between rank 50 and 60 is much bigger than the difference between 60 and 70. I call it “The Rob Gordon Effect” (ironic, because this character was kind of a loser).
There are many possible explanations, but I think if we’re honest with ourselves, we do make decisions based on news of success or failure: a breakout box office phenomenon is an “event” we all want to be part of. Nobody wants to be one of those people who haven’t seen Avatar, and no one wants to be mocked at the office for being the only person who was so out of touch to actually pay to see Johnny Depp’s “Lone Ranger”. Everyone wants to be associated with the winners, making it very hard for perceived underdogs to triumph. It’s not very romantic, but it’s true.
*
Ok, that was part 1. From here on, it’s all unnecessary brain drilling.
So far, we’ve established what could have been a perfectly adequate blog post all on its own. But if you are a truly brave nerd, here is a slightly more complex elaboration:
The above plot is actually not perfectly logarithmic. Upon closer inspection, we see that the log curve really starts only around rank 300. I know what you’re thinking – this can be a tricky observation, as the damping of the curve may be mistaken for linearity. Therefore, here are the four normalized segments of the curves: ranks 1-300; ranks 301-600; ranks 601-900; and ranks 901-1,131, with the box office grosses normalized on a range of 0-100, so that we can objectively compare the curvature:
1. For real blockbusters (over $120MM domestic gross), the recursive effect is strong, meaning blockbusters get a disproportionate extra boost in the box office by climbing up the ranks:

2. “Almost-blockbusters” ($70MM-$120MM domestic grosses) are less affected by this recursive effect: they are much less logarithmically organized, but not perfectly linear either:

3. And finally, smaller movies (ranks 601-900 and 901-1,131; less than $70MM domestic grosses) are almost perfectly linear:


The conclusion:
The conclusion of all this is that the “Rob Gordon Effect” really kicks in only for mega blockbusters (over $120MM domestic gross): they are disproportionately boosted by news of their relative success. But smaller films are in fact NOT affected by such news (especially under $70MM domestic gross). Therefore – there is a threshold above which a movie gets turbo-charged by its own success. The practical takeaway for studio execs is: if your movie has a chance of breaking that threshold ($120MM as of March 2014) – you should give it that extra marketing push. It will pay off.
* Raw B.O. data from boxofficemojo.com (1,131 films total).
– Like this post? Follow me on twitter: @stavjdavis and/or like the Facebook page
Recently, it feels like movies are getting longer and longer. Wolf, Smaug, Ranger, Fire, Prisoners, Superman and Gatsby – all clocked in at over 2h:20m. But is that perception skewed towards a few outliers, or are films actually getting longer? The answer is, as usual – complicated:

Two interesting patterns emerge:
First, the top-30 grossing movies are consistently longer than the top-100. That’s super interesting, but we should not rush to the conclusion that longer equals more successful. The correlation between runtime and domestic gross is actually very low for the top-100 (r-squared < 0.1) – a fairly odd result, which may imply that these blockbusters are unnecessarily long.
Second, for 22 years – between 1990 and 2011 – movies’ runtimes were pretty much steady (less than 6% fluctuations) for both the top-100 and the top-30. But then in 2012 and 2013 – the top-30 shot up by about 15%, while the top-100 remained steady. Is this the beginning of a trend? We’ll have to wait a couple of years to see about that.
But let’s look at a histogram of all these 2,400 films:

We see that this is not a pure bell-shaped Gaussian distribution: it is skewed to the right (the average is beyond the peak). This means that when films get longer – they can get really long.
But in any case, one thing is true: if you are like most Americans and primarily pay for tickets for the top-30 biggest blockbusters – you are not wrong if you feel these films are getting longer. But if you mix smaller films into your cinematic portfolio, that is not the case.
So why are blockbusters getting longer? Perhaps the producers want to justify the ticket price by providing the viewer with a long evening of cinematic entertainment – maybe even too long. Or perhaps the huge upfront costs of setting up a blockbuster production make the marginal cost of an extra 30 minutes of film negligible? Or perhaps it’s the competition from premium television’s longer and more complex story arcs?
* All the raw runtime data is from boxofficemojo.com (100 films for each year; 2,400 films total. Yes – a Python script did that).
– Like this post? Follow me on twitter: @stavjdavis and/or like the Facebook page
This is the third part of the International Box Office Correlations series. And it is worth the read, because this time we go beyond the scope of Hollywood, and plant the seeds for world peace, as well as explain geo-political turmoil! In the first part, we looked at grosses in the US vs. the rest of the world combined. In the second part, we looked at the US vs. every country separately. This time, we look at every country vs. every country, in what has turned out to be a giant colorful correlations-matrix that looks like a square Caprese salad. (The image is pretty heavy, so give it a fews seconds. It is followed by two half-matrices, so you can actually read the numbers).


How to use this?
Just pick a country on the vertical list and cross it with another one on the horizontal list. Darker green means a stronger correlation between the two countries. Darker red is a weaker correlation. White is somewhere in the middle.
A few observations
1. China, Nigeria and Japan are red all across. This means they are very individualistic in their acceptance of American films (be it due to local taste, language, local cinematic product, economics, distribution deals, politics, regulation, etc.). These three countries are not only different than the US – they are different than every other country – and that is not trivial.
2. Other “red” countries are India, Indonesia, South Korea, Uruguay, Thailand and Malaysia. But at least they have a few green cells in their arrays.
3. However, as opposed to the examples of Nigeria-China or China-Japan’s low correlations, in the case of India and Indonesia, they actually have a very high correlation between themselves, which means they probably share the same reasons for being so different from the rest of the world. Other examples of countries that probably share similar factors are: South Korea, Indonesia and Malaysia (red across the board, except among themselves).
4. The “greenest”, or “most-agreeable” countries are: Norway, Italy, Hungary, France, Russia, Germany, Australia, Mexico, Brazil, Turkey and South-Africa. This is a surprising list, because some of these countries are commonly perceived as having a very independent culture. According to this table, perhaps these should be spearheading international peace talks, as they seem to be the most relatable by the rest of the world :- )
5. Speaking of world peace: Lebanon’s second highest correlation is with Israel (0.79). Perhaps this will spark peace in the Middle East. The Netherlands and Germany are also closer than their soccer fans would like to admit (0.92). Turkey and Greece are as well (0.76) – don’t forget to thank HollyQuant when Cyprus is soon united.
6. In light of the recent events in Kiev, this seems relevant: the highest value in the matrix is Russia-Ukraine: 0.96. That is an extremely high value, even if the connection is obvious. This should probably trouble the pro-west protesters as it shows Russia’s control over the country through the CIS economic agreements. And all kidding aside, the recent cost of human life in the Ukraine is a real tragedy and I don’t really mean for this post to be anything more than just one more humble perspective on that matter. Even though this high correlation may be manipulated into supporting the claim that the Ukraine should remain a de-facto Soviet Russian entity, I believe that in this case, the number is not rooted in cultural similarities, but rather serves to prove the Russian economic stranglehold over the Ukraine – a stranglehold that is finally being cracked by revolution and bloodshed.
7. Other high correlation clusters can be spotted between the South American countries (e.g. Argentina-Chile (0.94), Argentina-Colombia (0.92), Bolivia-Peru (0.94), Colombia-Bolivia (0.93), Bolivia-Ecuador (0.93), to name a few); the Northern-European cluster (e.g. Finland-Denmark (0.92), Germany-Finland (0.91), Netherlands-Denmark (0.91), Netherlands-Germany (0.92), Norway-Denmark (0.92), Norway-Germany (0.94), Norway-Netherlands (0.92), Sweden-Finland (0.91), etc.); other European pairs (such as Belgium-France (0.91) Austria-Germany (0.94), Russia-Ukraine (0.96) and others); an East-Asian cluster (Singapore-Malaysia (0.91), Philippines-Singapore (0.91), Thailand-Malaysia (0.91); a weaker English-speaking commonwealth cluster that includes Australia, New-Zealand, the UK and South Africa.
8. Another important observation is that all numeric values are positive. This means that while some of the countries are extremely weakly correlated with others, none of them are negatively correlated (+1 means perfect correlation; -1 means perfect opposite correlation; zero means no correlation at all). This makes sense but is interesting nevertheless: none of the countries have an opposite behavior than any one of the other countries, when it comes to American movies.
9. Have more observations? Notice any surprisingly non-green pairs? Or non-red pairs? Please share!
How was this done?
A python script was used to collect domestic and foreign box office data for every country available on boxofficemojo.com – for the top 100 domestic films in 2011, 2012 and 2013 (300 films total). The table here is the correlations matrix of all those countries, based on the 300 film titles. A higher number means a stronger correlation. Theoretically, the numbers can be anywhere between -1 and +1 (-1 means perfect opposite correlation; +1 means perfect correlation; zero means no correlation at all). However, all the values in this table happen to be positive.
– Like this post? Follow me on twitter: @stavjdavis and/or like the Facebook page
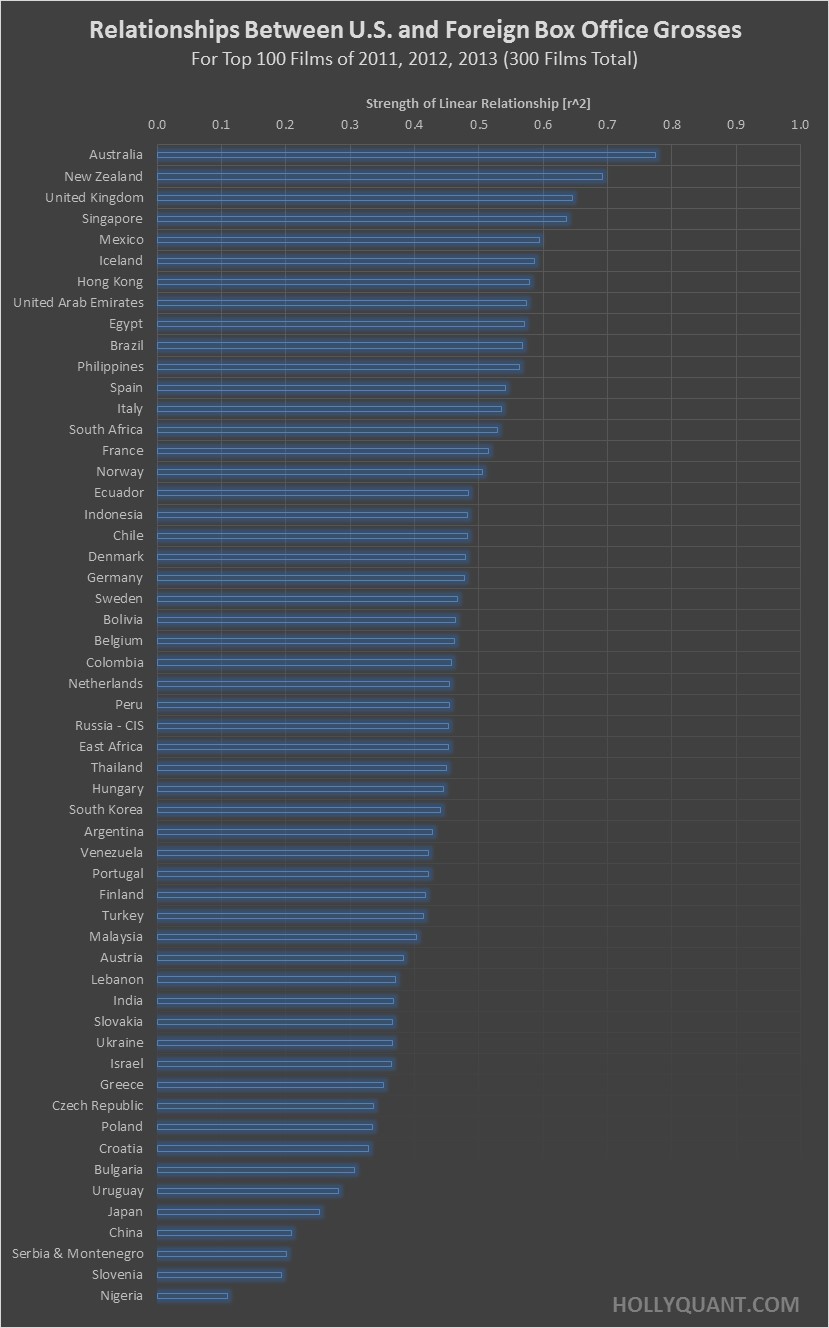
In the last post we took a look at the correlation between box office performance in the US and in all foreign territories combined. This time we take a look at the relationship between US box office and each territory separately. In other words: which countries have the most similar box office patterns to those of the US?
What does this mean?
A strong linear relationship, represented by a high r^2 value means that better box office performance in the US is strongly linked to better performance in a specific territory. Correlation is not causality, so we can NOT officially conclude that Australians, for example, just mimic Americans, but we can say that if a movie is released first in the US and does well, it is more likely to do well in Australia than it is in Slovenia, for example.
“Well, duh”, you may say – it’s no surprise that English speaking countries top the list. But where it gets interesting is when we notice that the United Arab Emirates and Egypt are way up there as well. Or that Eastern European countries are not necessarily infatuated with American hype. Or that the South American countries are widely spread across the list and are not as homogenous as stereotypically assumed. Or that China is way down at the bottom, contrary to some people’s impression that the Chinese have nothing to do but wait for Will Smith.
This list does not refer to the relative size of each market, but rather to the “ease of approach” to that market, so you may still prefer to target the Chinese market due to its sheer size, but I think it’s important to factor this gauge of local openness towards american cinematic product into the equation. Perhaps it will make some marketing team target Brazil before it targets Russia. Or maybe even Egypt before Japan (Hmm… Probably not, but still an interesting thought).
The list is of course affected by many variables: links in marketing budgets; varying cultural taste; economies of scale and scope in distribution; local industry competition; international politics and finance; pro- and anti-american sentiments; and many other potential reasons. Please contact me with any ideas about this!
How was this done?
A python script was used to collect domestic and foreign box office data for every country available on boxofficemojo.com – for the top 100 domestic films in 2011, 2012 and 2013 (300 films total). This plot shows the r-squared values, representing the strength of the linear relationship between box office grosses in each territory and box office grosses in the US, based on the 300 titles.
– Like this post? Follow me on twitter: @stavjdavis and/or like the Facebook page
In the new HollyQuant spirit of “more python code, less talk”, here are today’s findings:

How was this done?
A python script was created to collect domestic and foreign box office data for every country available on boxofficemojo.com – for the top 100 domestic films in 2011, 2012 and 2013 (300 films total). This plot shows the non-U.S. total (all countries combined) for each of the 300 titles and their fairly strong correlation (r^2=0.71) with domestic performance. A breakdown by country will be discussed in the next HollyQuant post (very interesting findings there).
What does this mean?
This means that while U.S. box office may be losing ground in terms of global market share (see older post on that), it’s still a good indicator of international box office performance. While we keep in mind that correlation is not causality (therefore, we should not conclude that U.S. buzz is a direct factor of international success), what we can say is that if the film was made by serious people who properly marketed it in the US, it has very good financial prospects abroad. Every gross dollar earned domestically translates into an additional 1.57 dollars in total foreign grosses. Of course there are always outliers (Disney’s ratio is probably better than Lionsgate’s for now), but if you were to blindly choose a bunch of random titles, this would be a good estimate.
The next post will discuss the super interesting finding regarding the correlations of domestic performance and performance in each specific country.
– Like this post? Follow me on twitter: @stavjdavis and/or like the Facebook page
From my experience, when Hollywood executives hear the word “drama”, they tend to suddenly remember a prior engagement, politely end the conversation, exit the room and start running until their distant cries of hysteria blend into the massive exodus of other industry professionals who caught word of the project and are now fleeing in any vector that is pointing away from the mentioned production.
It seems that this notion is one of the most violently engraved paradigms of the industy’s psyche. It’s as if the rule of thumb is: “unless it has a real shot at major awards, stay away from dramas”. Comedies are cool (we’ll see about that), horror is awesome (not), action is just dandy (sure, if your underwear is made of pure gold). But dramas seem to be lepars. And no one I talk to can really pin point why. So I set out to investigate the numbers.
The first step is also the simplest one: finding the Return On Investment (ROI) of different genres. This was done by aggregating all the films released on more than 500 screens, between 2008-2012 (kudos to our new data mining tool at Great Road Capital), that have production budget data publically available on boxofficemojo.com – and averaging the ratio of domestic box-office-to-budget, for every genre. Here is what it looks like:

This is a great example of why I don’t like averages and means, but we’ll get to that in a bit.
First, we can see that there isn’t a significant difference between “heavy award contenders” and just regular dramas[1]. In fact it looks like “Pure Dramas” do slightly better than the much larger group of drama sub genres (which may include films that are really action/thriller/fantasy films with a small drama element). Second, we can see that while horror is way up there, dramas actually do better business, on average, than action movies or, surprisingly, comedies. More about that at the end of this post.
So that didn’t quite explain the hatred towards dramas.
The next thing on the agenda is to try to define risk. Anyone with a basic understanding of statistics knows that averages can be very misleading, if they are not coupled with some kind of estimate of the spread around that average/mean. One of the first things we ask at GRC when presented with a seemingly compelling “average argument” to support a pitch for a project, is “what is the standard deviation?” and “what is the size of your sample?” (and of course – “did you cherry pick that sample?”). So in order to get a better look at the genre comparison, the risk for that same group of films was defined as the normalized ratio of the standard deviation to average of the domestic box office (don’t worry about the sample size – it’s at least 50 films[2] for each category and I promise I have no agenda here, so cherry-picking did not take place). Here are the results:

Now we are starting to see why producers and development execs have a bad hunch about dramas: while they may do well on average, they are a wild card, especially compared to comedies. If I could invest in a thousand movies – having all of them be dramas could be a good idea, but if I have to randomly pick one investment, dramas are just too unexpected. Horror is less volatile than I expected, but don’t forget that this study only includes the movies that got a 500+ screen release, and not all of the trashy low budget productions that barely make it to the production finish line and end up on 3 midnight screens in New Mexico at best. Action movies are even more stable than comedies, but that’s a reward that only the big players have the resources to tap into.
The third aspect that seemed very relevant is each genre’s dependency on budget. This was calculated by normalizing the r-squared value of the domestic box office vs. production budget spread plot. Here are the results of that:

Here we see that big studios and their action flicks are the big winners: every dollar invested in the budget is far more likely to yield an extra dollar at the box office in this genre than in all the others. Comedies and dramas have a budget-to-box office relationship that is about half as strong and horror is way behind: a more expensive horror production does not translate into better financial performance (which reduces the advantage of big players in this genre – more on this in a bit).
So, to summarize, here are all three plots together:

What this all means:
If you have a huge amount of capital, like studios do, it makes sense to go for action mega-movies, because while their relative return is lower, their absolute return can be higher and their risk is relatively low, plus you know that every dollar you put into the production is probably going to have an impact on revenues.
While lower risk is the privilege of the rich, if you are a medium sized independent production company, comedies are a nice option[3]: a relatively low risk (yes, I know that’s a kind of oxymoron in this industry), coupled with un-spectacular-yet-fairly-solid returns. A medium dependency on budget means that you have a chance of making it work even if you don’t have a giant pool of cash, while still keeping the barriers to entry high enough so the landscape is not too crowded (which is the biggest problem for horror productions). This is, of course, not to say that comedies are always winners, but they are less of a wild card.
Moving on to the low budget production houses and their love of horror: even after the exclusion of “Paranormal Activity” from the sample[4], there is a very low correlation between budget and performance – which is good if you, well, don’t have much of a budget. However, this translates into low barriers to entry, which means that everyone is trying to do horror, resulting in performance that is extremely unpredictable (and that doesn’t even include the ones who never made it to the finish line). When we get pitched horror scripts, we need to see why a specific one is unique: it’s not enough to rely on the memory of a few recent Cinderella stories, because for every meteor horror success story, there are so many crashes-and-burns. It’s very hard to make horror that is both good and successful, as proven by these numbers.
And finally, dramas: now that we have a more detailed picture of film performance elements (on top of the simplistic misleading average performance argument), you can see why dramas are the pariahs of the film industry: while they have a reasonable relative return, they have an insane risk level, regardless of their award-worthiness or purity of genre. In addition, they have a medium correlation between budget and performance, meaning that only medium-large players can effectively exploit those seemingly attractive returns.
Notes:
[1] Note that while the many sub genres of drama may include things like “fantasy drama” or “action drama”, the category of “Pure Drama” includes only films categorized by boxofficemojo.com as “drama”. When evaluating that list, the vast majority of those were accurately categorized as such hardcore dramas, with only very few odd exceptions that were omitted.
[2] Sample sizes (number of films with available production budget and domestic box office data): “All Drama Sub Genres” – 124; “Dramas Not Including Best Pic Noms” – 107; “Pure Drama” – 97; Comedies – 219; “Horror” – 61; “Action” – 80; “All Movies” – 718.
[3] This recommendation is obviously a bit superficial, as we can dig into many additional important details, such as the international-vs-domestic appeal of this genre, which is crucial for independent productions as international pre-sales are the key to debt financing of the budget, while domestic appeal is the key to actual revenues (in most cases).
[4] For the horror genre, the film “Paranormal Activity” was left out of the list, since it’s performance was so far out of range (it had an extremely abnormal behavior: 15,000x ROI) that it managed to skew the results, even though the sample size was large.
A few general notes and caveats:
– These results refer only to domestic box office. The picture might be different for international box office.
– The list of movies evaluated here pools together studio productions and independent productions, which have very different financing and development processes, so the conclusions might vary depending on specific project conditions.
– Of course, production budgets are different than total budgets (which include marketing and P&A budgets – that have been proven in this blog to have a significant impact on performance), but given the large sample sizes for each genre, these results should still provide a pretty good picture of the general performance trends.
– Like this post? Follow me on twitter: @stavjdavis and/or like the Facebook page
This post was originally published here a couple of months ago and included a plea for help in making the data more approachable via better infographics than those my ugly hands can produce with Excel/Matlab. RJ Andrews who runs infowetrust.com came to the rescue and together we collaborated to create this first class infographic. He did an amazing job and I hope we will work together again!
We took a look at Lionsgate – often called a “mini-major studio” or “the sixth of the Big Five”. How did this happen? How could a company that was founded in 1997 by a banker from Vancouver take on the film industry under its own terms and without the backing of a major media conglomerate like the other big ones? Many voices say they got lucky by hitting gold with The Hunger Games right after acquiring Summit and the rights to the Twilight Saga. But that’s just the tip of the iceberg, in what turns out to be a very deliberate, aggressive and strategic expansion effort over the past 15 years.
The company got to where it is primarily by making bold, brave, risky and sometimes stupid moves. Don’t get me wrong – they made some films that were utter nonsense, but they also took a risk on American Psycho after Disney got spooked by its uneasy premise. Or Lolita, which had a hard time finding a home in the late 90’s. Or Kevin Smith’s Dogma, which required some guts to believe in before it became a cult hit.
And then there are the strategic investments in streaming video as early as 2000(!) and its focus on the growing Latino film market.
At the core of all this are the strategic acquisitions that Lionsgate has been putting together like crazy over the past decade, focusing on expansion of its title library and distribution network – domestic and international, as well as its independent production capabilities, strategic partnerships and expansion into TV. Independent film production companies should study this if they want to break away from the pack.
Here is our beautiful infographic. A huge thanks again to RJ Andrews for this – it looks beautiful, if I may say so myself.

* For the backstory of the infographic – check out RJ’s post on his blog.
* Like this post? Follow me on twitter: @stavjdavis and/or like the Facebook page
Here is a wrong statement: “If there weren’t any horror movies released recently, your horror flick will do better”. In the past few months we have witnessed so many horror movies doing very well: Mama, Evil Dead (remake), Texas Chainsaw 3D, Paranormal Activity 4, Sinister and others. This genre was never intended to make hundreds of millions, but since it is by far the cheapest to produce – it has become a gold mine for anyone who gets it right.
The opening statement here is wrong, even though it feels very intuitive: if I got my dose of nightmares to last me a couple of months, why would I need to see another horror movie any sooner than that? Well, it turns out that while this logic may seem reasonable to a scaredy-pants such as myself, it does not hold for horror lovers.
Here is a plot of all the movies released between 1997 and July 2013 that were categorized by boxofficemojo.com as “horror” of different kinds. I narrowed it down to those that had a wide release (>2000 screens):

R-squared = 0.02. That’s a pretty much non-existent correlation. A similar picture can be seen for opening weekend grosses:

What does this mean?
It means one of two things, or both: 1. Horror film audiences don’t need a hibernation period to digest the harsh scenes from one movie before they are ready for the next; 2. Marketing, as usual, is the determining factor of a horror movie’s success, regardless of the genre-similarity of competing brands (a conclusion I keep reaching on this blog).
I’ve heard someone say that there is a theory running around Hollywood, according to which a horror movie will make more money if it is released more than 8 weeks after the previous horror release. On average – that may be true ($67M vs. $61M for all movies, which is a roughly 10% gain), but the variance is so big that it makes the whole statement non significant.
In a future post, I will take a look at other genres, but horror is such a well-defined one, that I had to go for the low hanging fruit first. So if you are an exec, sweating over a release schedule decision for your horror flick – take it easy. I would pay more attention to what other genres are doing on your potential opening week (see the previous post on that surprising matter) than what your fellow horrorists have been up to recently. It just doesn’t matter. Oh – and don’t forget to market the living daylights out of it, of course.
* Like this post? Follow me on twitter: @stavjdavis and/or like the Facebook page
** All raw nominal grosses, release dates, theater counts and genre classifications are from boxofficemojo.com
Here’s what Google can teach us about one of the past decade’s most significant changes in film marketing and promotion: Anticipation campaigns.

The relative search volume (in the United States) of the search term MOVIE RELEASE DATE has shot up by about 3x since 2009 (the blue line), whereas the relative search volume of BUY MOVIE TICKETS has remained fairly steady (the red line). (Note: Google normalizes the numbers so that they represent a specific term’s search volume relative to total Google search volume, so this accounts for Google’s own growth).
Now, of course, the red line might be affected by the growth of websites like Fandango that might have “stolen” traffic from Google, but the important graph here is the blue one: people are becoming significantly more intrigued by promotion campaigns for movies that are still far from release. Just like in the movie “Inception”, the idea is planted in their minds and marinates there for a few months.
But why did this happen?
The first reason is that the industry’s marketing teams took their time but finally, somewhere in 2009, they realized the potential of social networks and their ability to exponentially grow buzz over time.
But I believe another reason is that moviegoers are overwhelmed by the growing number of weekly releases competing for their attention – more specifically, blockbusters.
Ten years ago, it was enough to throw $150M at a production to make it a “must see”. But once all the studios learned that trick, we started being bombarded with too many of those mega movies, “The Lone Ranger” being the most recent victim of this inflation.
The result is that the concept of spontaneous ticket buying has taken a hit. I know from my own experience that I rarely just go to the cinema to see whatever is playing. I now have a checklist of movies I want to see ever since their first trailer was released over six months ago. And the longer a movie is on that queue, the higher it climbs up the list, making the chances of it actually being watched and paid for at the box office, higher.
I didn’t have such a checklist in 2005. Did you?
* Like this post? Follow me on twitter: @stavjdavis and/or like the Facebook page
Have you noticed that “Olympus Has Fallen” and “White House Down” are basically the same movie? Yeah, you probably have. And do you remember having that feeling in the past, with “Oblivion” and “After Earth”? And what about “Mirror Mirror” and “Snow White and the Huntsman”; “Friends with Benefits” and “No Strings Attached”; “The Truman Show” and “EdTV”; “Dante’s Peak” and “Volcano”; “Armageddon” and “Deep Impact”? The list goes on and on.
Here is a look at a bunch of such twin movies – all of them are clearly descendants of a common ancestor-script and were released within a few months of each other. They are arranged chronologically (from bottom to top) into pairs and then compared according to their production budget, worldwide grosses and ROPB, which is a term I invented for Return On Production Budget (kind of like ROI):

So, before I plotted this thing, I thought I’d get a clear pattern showing that the first movie of each twin-pair to be released will be the winner, as in the case of Olympus vs. White House, but that didn’t happen. Then I thought perhaps grosses depend on budget, but that too was not the case and the ROPB doesn’t show any clear patterns either.
I slowly reached the sad conclusion that these are most likely case-by-case scenarios, in which marketing is probably the biggest X factor: in some cases, the general buzz is shared by both twin-movies, especially when they are well differentiated – like in the case of “Armageddon” and “Deep Impact”, or “Dante’s Peak” and “Volcano” – which nourished each other by making it clear that while they are similar in concept, they are different in the experiences they offer.
The first mover advantage comes into play when the two movie-brands are mixed up and tangled into each other – like in the case of “Olympus” vs. “White House Down”: they were both perceived as “that White House destruction movie” – if I saw the first one, why should I see it again?
A good marketing campaign is one that not only creates anticipation for a concept, but also creates awareness to a specific and unique production version of that concept. In my experience, a good example is “The Truman Show” vs. “EdTV” – Truman came out first, but that’s not why I saw it rather than EdTV at the time. I remember very clearly waiting for the specific “Jim Carrey borderline-artsy movie”.
The same applies for “A Bug’s Life” that was beaten to the release-line by “Antz” but ended up doing much better – because viewers knew it wasn’t just “another cartoon about bugs”. The same applies to “Snow White and The Huntsman” that was well differentiated from “Mirror Mirror” – by emphasizing its darkness, style, unique special effects and star power.
The bottom line:
If you are a studio exec and you know your competitors are working off a similar (if not identical) primary script darft – don’t focus on being the first to the finish line. Rather, focus on making your presentation of that concept unique and easily differentiated, via creative production value (harder) or original marketing efforts (a bit easier).
* Like this post? Follow me on twitter: @stavjdavis and/or like the Facebook page
** All grosses figures and most budget figures for this post are from boxofficemojo.com. Some production budget figures are from The-Numbers.com
A couple of weeks ago, “This is the End” opened against “Man of Steel”, in what seemed to be a kamikaze mission. In the right corner – a square-jawed giant with a $225M budget. In the left corner – a bunch of stoners with a skinny $32M budget, a lot of heart and admirable determination.
And then a great thing happened. No – “End” didn’t beat Superman, but it did pretty well, grossing $32.4M. And so did Superman, with $156.7M. Everyone wins.
Wait, what do you mean everyone wins? How can everyone win?
Well, if you truly embrace who you are on the spectrum of film sizes and correctly position your expectations according to the three tiers of movie budgets (over $70M, $20M-$70M and under $20M) – you quickly realize that films in other tiers aren’t your enemy.
Let’s take a look at the relationship between the weekly grosses of the movie in 1st place vs. the weekly grosses of the movies in 2nd place, for movies that had a weekly gross of up to $200M (which excludes The Dark Knight Rises and Iron Man 3, because they are both in a world of their own), during the last year (=50 weeks) (all data from boxofficemojo.com):

Another way to look at it is through average per-theater weekly grosses of 1st vs. 2nd places (all numbers are from boxofficemojo.com):

In both charts there is a positive relationship. It’s not incredibly strong (r-squared = 0.3-0.4), but it’s definitely not negative: the big guys aren’t gobbling up the little guys. When the big guys do better, so do the little guys. They exist in a different, parallel, box office universe, but there is a connection between the two universes – a connection of positive support – not cannibalism.
Now, we all know that correlation is not causation. This relationship might not be a direct one: perhaps holiday weekends mean a bigger pie for everyone, or perhaps there is a “leakage” effect – where the lines for a blockbuster are so long that some people just end up going to a different movie. Or maybe some people go to see the non-blockbuster so that they can say they’re special. I don’t know.
The exact reason should be further investigated, but my point is that I’m not saying you should necessarily take on Jerry Bruckheimer. Rather, I’m telling you not to write off that idea as quickly as intuitively recommended. He doesn’t want to take your toys – he doesn’t care about them. In fact, it is likely that the more toys he has, the more you will get to keep for yourself.
* Like this post? Follow me on twitter: @stavjdavis and/or like the Facebook page
Startups are good. Startups mean innovation. Startups are the reason high-tech and biotech are the future. Startups are the core of the American competitive advantage. An abundance of startups is a sign of a healthy, evolving, competitive industry. A lack of startups is a sign of conceptual inbreeding of the same ideas over and over and over by a few reigning giants.
So where are the startups of Hollywood? Show me the Startups!
One answer would be – here they are:

The above chart shows the number of feature releases by distributor. At first, it looks amazing – look at all those movies distributed by companies that are not the big guys!
But wait. Quantity is never a good measure on its own. Lets look at real grosses by distributor:

Oh snap. That doesn’t look as good. In fact, it seems that while everyone is weeping about overall box-office stagnation, the big guys are actually growing. It’s the little guys that are having their share of the pie significantly eroded.
Another way to look at this is through ticket sales:

Same picture. The leakage in total ticket sales is coming only from the “others” compartment – not from the big players.
And finally, let’s look at market shares – the ultimate battle score:

Again, we see that since 2004 the little guys’ market share had evaporated from 29.7% to 12.2%. The big distributors are eating into their share.
What does this mean?
It means that we are seeing more and more movies being released by new players that are not part of the “Big-7” (I include Lionsgate in that group – see why here), but these players are fighting among themselves for a shrinking piece of the pie. It means that indies are hurting. It means that this industry needs shock treatment or it will consolidate into a predictable formulaic machine.
Dear studios, Indies were once your dogs – the ones who ran ahead and brought you innovation in their jaws. But now during this winter, you feast on their own flesh, feeling good about your own growth – but what will you do after you’ve eaten up all your dogs?
I realize that big studios own the big distributors and that even bigger conglomerates own the big studios. I realize that cinema is evolving into nothing more than a promotion tool for home entertainment, merchandize, and amusement parks. I realize there is a bigger picture. But the even bigger picture is that at the core of all this is creativity and innovation – new heroes, new genres, new formats.
It’s great that over 650 movies were released last year, but if the vast majority of them were screened in a couple of hidden locations in Tribeca, what’s the point? Innovation rarely comes from fat and happy incumbents, which is what we have here.
* Like this post? Follow me on twitter: @stavjdavis and/or like the Facebook page
** Raw nominal data source is from The-Numbers.com. The data there is very similar to the data on boxofficemojo.com, but runs further back to 1995.
Superheroes have everything that (corporate) Hollywood loves – for better and for worse: a pre-existing and loyal fan base, franchise potential, visual 3D extravaganza potential, merchandise and amusement park revenue streams, undemanding plot logic requirements, easy formulaic scripts, predictable humor and much more. On the other hand, the cost of differentiating them is increasing beyond the ability of small players, which are gradually disappearing in this consolidating landscape.
This has been the decade of the superhero, and more specifically – the decade of Marvel’s superheroes. DC Comics, which is owned by Warner Bros., is still hanging in there, but they have only managed to capitalize on two key franchises – Batman and Superman. The first had a very good run with Christopher Nolan, but that’s over now and the latter is being rebooted these days – and doesn’t seem to be of the same scale.
Let’s take a look at the huge growth in this domain and at the changing relative market shares – by comics’ publisher (who own the rights to the characters) and by distributor:
![Worldwide Box Office Grosses of Superhero Films - by Comics' Publisher [Real 2013$]](https://hollyquant.com/wp-content/uploads/2013/06/superhero-films-by-publisher.jpg "Worldwide Box Office Grosses of Superhero Films - by Comics' Publisher [Real 2013$]")
![Worldwide Box Office Grosses of Superhero Films - by Distributor [Real 2013$]](https://hollyquant.com/wp-content/uploads/2013/06/superhero-films-by-distributor.jpg "Worldwide Box Office Grosses of Superhero Films - by Distributor [Real 2013$]")
You would think that since the Disney-Marvel merger of 2009, Disney would shoot forward as the leading distributor in this domain, but apparently (according to this article) – so many of the Marvel characters are tangled up in very complex licensing deals with all the other studios, so it will be years before Disney will be able to fully capitalize on its Marvel assets in the way WB is doing with DC Comics. But once the lawyers get paid, or once the current licensing agreements expire – we will probably see Disney emerge as the dominant Superhero player. WB & DC will always be relevant, but it looks like Marvel is doing a much better job at leveraging its arsenal of characters.
In any case, the domain of superheroes is consolidating. On the publishers’ front – the past decade and the decade to come will be dominated by Marvel. Most of the leftovers will go to DC Comics, but all the smaller players will have a much harder time, as these productions become more and more extravagant and expensive to produce and market.
On the distributor front – the upcoming decade will show a gradual shift in Disney’s favor, at the expense of Paramount and other studios that had licensing agreements with Marvel. Warner will have to up its game if it wants to rise to the level of Disney-Marvel. The others will have to figure out what to do, as there’s not much left for them in this domain. Perhaps coming up with original superheroes? Yeah, right…
* Like this post? Follow me on twitter: @stavjdavis and/or like the Facebook page
Word-of-mouth is a nice buzz expression. But you should be careful when and how you use it. Companies like Cinemascore have spent the last couple of decades gauging viewers’ responsiveness to movies as they leave the theater. It is common perception that if a movie gets an A+ score is likely to have a good run due to positive word-of-mouth. If it gets an F (like Brad Pitt’s recent “Killing Them Softly”) – they are expected to crash and burn very quickly after the first week.
BUT that’s not always true.
Rotten Tomatoes’ thousands of users’ scores (which are different from their critics’ scores) can be used as a gauge of word-of-mouth: if I gave a movie a bad score, I will probably tell all my friends that I didn’t like it. So let’s compare that to box office performance after the first week in theaters – aka “box office decay over time”.
If we look at the top 90 box office films of 2012, we see somewhat of a correlation between Rotten Tomatoes users’ scores (not critics) and box office decay over time: R-squared = 0.25 – fairly weak, but still there (wait for it…)

But here’s the punch:
When you look only at the top 30 performers at the box-office in 2012, that correlation drops to almost zero:

The situation is similar for the next 30 films:

But then, when you look at the films ranked 60-90 at the box office in 2012, that correlation shoots up – R-squared = 0.5 ! A higher score correlates to more money made after the first week (=smaller decay over time):

What this means:
This means that the mega blockbusters are controlled by their marketing, or by the power of the franchise or by whatever – but not by what your friends tell you about the movie. Think about it – how many people told you not to watch “Ice Age: Continental Drift” and yet – you watched it anyway? That movie got a user score of 63, implying people are not saying good things about this movie, and yet – it made 81% of its total grosses after the first weekend – a very low box office decay over time.
On the other side are the more modest movies – those that bring in $30M-$50M. Those movies’ performance after the first week is much more sensitive to word-of-mouth. And that makes sense: when you don’t have a gigantic brain-washing budget, you have to actually make good products.
The bottom line: We watch mega blockbuster “event” films because we have to – it’s primarily a social obligation and only then an emotional entertainment experience. And then we watch smaller films in order to satisfy our personal need for quality entertainment. In other words: we watch Spider-Man because we have to, and the fact that it is good or not will not change our actions. But we watch Lawless primarily because someone we trust told us it is good.
* Like this post? Follow me on twitter: @stavjdavis and/or like the Facebook page
In her Golden Globe acceptance speech, Silver Linings Playbook star Jennifer Lawrence thanked Harvey Weinstein for “killing whoever you had to kill to get me here”. I assume he didn’t literally kill anyone, but the creativity of The Weinstein Company’s business tactics have always rivaled the creativity of the films it so successfully distributes.
One of those tactics is Slow Releases, aka Platform Release, and the latest example of it was the surprisingly very-successful Silver Linings Playbook. When I looked at its cumulative grosses six weeks after its release many months ago, I thought “$23M gross for an $18M budget – good for them for breaking even, but it’s a shame they didn’t make more”. But somehow that was only the tip of the iceberg, as the movie went on to make over $130M domestically. That’s amazing, since the vast majority of movies make 80% of their total grosses within 3-4 weeks from their release.
Here is a typical normal release, or “fast release”:

It gives everything it’s got in the first week or two and then crashes – making over 80% of its total grosses in the first three weeks. That was the model I was using in my head when I thought Playbook was at the end of its run after six weeks.
Now take a look at these seven Slow Release movies and their average weekly grosses and average cumulative grosses (the thick blue lines):


This is a completely different model. First, their weekly grosses reach their maximum only after a few weeks, and not on the first weekend. Second, they reach 80% of their total grosses only after 12 weeks! (Of course, there’s a bit of a variance here, but you get the point).
So basically, Weinstein and all the other small-but-clever distributors are saying: “well, we can’t compete with the big studios’ marketing budgets so let’s use a kind of Bass model of brand diffusion [add link to wikipedia] and use indirect marketing (word of mouth, awards and general buzz) to gauge our distribution expenditures”.
Of course this will work better with good movies, since they can hit an inflection point after which they self-propel themselves to success (like “Playbook” the six other movies in the figure above). But testing the market before blowing millions on marketing can also be beneficial if you have a flop on your hands: if you see it’s not gaining traction in 200 screens you can either pull it off the circuit and cut your losses or decide to give it a little extra boost with a proper marketing budget.
* Like this post? Follow me on twitter: @stavjdavis and/or like the Facebook page
Dear fresh college grads who are looking to break into the film industry,
I have some good news and some thought-provoking news. First, the good news: the film and video industry looks like it is becoming more favorable to entry-level employees:


The above figures (data from the Bureau of Labor Statistics) show that for occupations such as “Film & Video Editors”, “Multimedia Artists & Animators”, “Writers & Authors”, “Administrative Support”, and “Producers & Directors” – the number of employees is growing at a higher pace than the industry average, while the median real salary is eroding, compared to the industry average. This means that there is a shift towards entry-level jobs: more busy hands for less pay. That’s good if you are looking to break into the industry (and not so good if you are a replaceable seasoned professional).
And now for the thought-provoking news: take a look at this figure:

“Annual Expenditure” is basically the number of employees in each category multiplied by their mean annual wages. The red line is the industry average – across all occupations. You will notice that “Office & Administrative Support Occupations” are losing ground, while “Writers & Authors” and “Producers & Directors” are skyrocketing and “Film & Video Editors” are also beating the average.
This means that if you are looking to become some exec’s assistant as your first step in the industry (as so many fresh college grads do), you really have to bring some kind of added value – either creative insight or technical expertise. If your only advantage is in managing a call sheet, you are not in a very favorable competitive position: you will either be replaced by a computer or by someone with unique abilities. Even if you’re not a writer or officially in the “creative” department – you really must bring creative thinking to your work. As I mentioned in my previous post – the days in which sending more emails per minute or arriving early and staying late were the only differentiating factors are over. Hollywood has finally joined the 21st century and is looking for creative thinkers that bring unique added value.
The unionized nature of the film industry is probably the reason the industry average is not doing even worse, but the trend is clear. At its core, Hollywood is a creative industry after all – one that is harder for computer algorithms to replace entirely. But that actually incentivizes it even more to become efficient wherever it can – and that is wherever human creativity is not essential.
Please. Stay away from those jobs.
* Like this post? Follow me on twitter: @stavjdavis and/or like the Facebook page
The coolest job on the official Bureau of Labor Statistics list of “Film and Video” industry occupation is definitely Motion Picture Projectionist. But since that is a fantasy job which requires mystical powers, I will focus this post on more viable options for my average readers.
Let’s start with Total Industry Jobs:

This has been a remarkably steady industry over the past decade in terms of number of employees (364,600 in 2003 vs. 358,190 in 2012). However, the median annual wages have risen by about 30% in real terms. Together, these two trends are different than most industries, where such increases in pay are coupled with a decrease in employment numbers, as technology makes the workplace more efficient, meaning higher wages for those who were not replaced. Many examples of such industries can be found in the popular blog written by Prof. Andy McAfee of MIT (whose research assistant I used to be). More on these larger scale trends in the next post. This post is about specific industry jobs.
So let’s start with the bad news. Here is a look at Office and Administrative Support Occupations, a popular option for fresh college graduates:

This is a more intuitive trend: 28% drop in number of employees, while wages remain steady, in real terms. This means that this segment is becoming more efficient, probably due to technology integration. So what are the occupations that are making up for this drop in total headcount?
Let’s see what’s up with more skilled occupations.
Film and Video Editors:

Over 30% increase in number of employees, with a slight increase in pay. This means a good editor is in increasing demand. Hurray for editors!
Multimedia Artists and Animators:

Here we see a 50%+ increase (!) in employment with only a very slight drop in pay. That makes sense – Hollywood needs lots of After Effects experts. Good on ya! (but take a look at my next post for a little caveat).
Next, let’s take a look at the real stars of the last decade – Writers and Authors:

There still are not too many of those, but their number has more than doubled(!!) with a nice increase in salaries. Human creativity is key to survival in today’s world – not only in Hollywood. This is more in line with Prof. McAfee research, and is key to your survival in the workplace. Even if you’re not a writer or officially in the “creative” department – you really must bring creative thinking to your work.
Now, let’s look at another star segment: Producers and Directors:

Here we see a whopping 3x increase in employment, coupled with a small increase in real pay. This can have many explanations, but I believe it is key proof of the fact that Hollywood is increasingly emphasizing agile thinking over repetitive blind labor. There is an increasing need for “producer/director-types” – adaptable, creative leaders.
The conclusion is that Hollywood is becoming more intelligent. It is seeking creative, adaptable, quick, original thinkers, rather than repetitive key punchers. Menial tasks can be done by a computer or by the studio’s president’s son, because there is no better way to filter potential talent for those jobs. Don’t compete against them. Show you have irreplaceable added value. This is the new reality, and it is a good reality – an intelligent, meritocratic, human reality.
* Like this post? Follow me on twitter: @stavjdavis and/or like the Facebook page
This post has been republished here – with an incredibly improved infographic! You really want to see it. It’s amazing.
***
Original post:
Welcome to my ugliest post yet! Most of the feedback I get concerns the aesthetics of my charts and all I can say is that I’m working on improving that. But for now, I still have to produce at least one of these a week.
Anyway, this time I took a look at Lionsgate. Often called a “mini-major studio” or “the sixth of the Big Five”. How did this happen? How could a company that was founded in 1997 by a banker from Vancouver take on the film industry under its own terms and without the backing of a major media conglomerate like the other big ones? Many voices say they got lucky by hitting gold with The Hunger Games right after acquiring Summit and the rights to the Twilight Saga. But that’s just the tip of the iceberg, in what turns out to be a very deliberate, aggressive and strategic expansion effort over the past 15 years.
The company got to where it is primarily by making bold, brave, risky and sometimes stupid moves. Don’t get me wrong – they made some films that were utter nonsense, but they also took a risk on American Psycho after Disney got spooked by its uneasy premise. Or Lolita, which had a hard time finding a home in the late 90’s. Or Kevin Smith’s Dogma, which required some guts to believe in before it became a cult hit.
And then there are the strategic investments in streaming video as early as 2000(!) and its focus on the growing Latino film market.
At the core of all this are the strategic acquisitions that Lionsgate has been putting together like crazy over the past decade, focusing on expansion of its title library and distribution network – domestic and international, as well as its independent production capabilities, strategic partnerships and expansion into TV. Independent film production companies should study this if they want to break away from the pack.
Here is my attempt at creating the world’s ugliest infographic to show this unique company’s systematic growth (if any graphic designer wants to prettify this – hit me up in the contact form).


* Like this post? Follow me on twitter: @stavjdavis and/or like the Facebook page
In a previous post, I looked at the connection between a film’s Rotten Tomatoes score and its box office performance (reminder: there isn’t much of a connection). This time I wanted to see what kind of statistical relationship exists between what critics think of a movie and what the general public does. I used the top 100 grossing movies of 2012 as the dataset and looked at each of their Rotten Tomatoes scores – each has two scores: a critics’ score and a general website users’ score. Hence: “Critics vs. Humans”.
This is the initial result (wait for it – there’s more):

I was disappointed by this result, because the R^2 value of 0.51 is inconclusive: there is some kind of linear connection, but it’s not too strong. In addition, the fact that user scores are 42.8 points higher than critic scores is pretty amazing, but further weakens the connection between the two score sets.
So since that was not conclusive enough, I broke it down by box office performance – 1. over $100M and 2. $30M-$100M in domestic grosses. This was more conclusive:


Now we see that the linear connection is much stronger for the big blockbusters (R^2 = 0.69) vs. the smaller movies (R^2 = 0.33). The average difference was still over 40 points, but for blockbusters we can at least say with a fair level of confidence that an increase of 1 point in critic scores is worth an extra 0.498 points in general-user scores.
What does this mean?
It means that the critics and the general public are much more aligned in their opinions of blockbusters. And that can mean one of two things: either critics are influenced by the higher visibility of blockbusters and skew their scores to match the general buzz about them (negative or positive); or blockbusters are much more formulaic and therefore are easier to assess in a consistent manner by using the blockbuster framework that is familiar to everyone – professionals and non-professionals.
I think both theories make sense.
* Like this post? Follow me on twitter: @stavjdavis and/or like the Facebook page
Summertime is here. And so are its blockbusters. It seems like not too long ago Christmas was here, with all of its blockbusters. It’s a bi-annual Deja-vu. But I always felt they are different. And this is why:

First, I plotted the average monthly grosses of all movies released in the decade between 2003 and 2012 that grossed more than $1M. But that was a pretty obvious graph (the blue one).
However, when you add the average number of monthly releases to the picture – things get more interesting: in the summer, the number of releases plunges, while total grosses soar, while in contrast – around Christmas the number of releases goes up together with the grosses. (Also notice that August, September and October are the season for a ton of releases that don’t fare too well at the box office – another interesting phenomenon). This is an anomaly that sheds a lot of light on the whole strategy behind different kinds of films and more importantly – different kinds of audiences.
If fewer movies mean more total grosses in the summer – then this means that the industry has determined that “network effects” draw revenue from people who would otherwise not go to the cinema at all. In other words: kids, who are the prime audience in the summer, either go to watch a blockbuster or they don’t go at all. That’s why no small movies dare to go up against the blockbuster – if you’re not confident you can hit the initial critical mass of viewers required to get traction – you shouldn’t enter the race at all.
In winter, however, more releases go together with higher total industry grosses. I believe that the explanation for this is that in the winter, especially around Christmas and New year’s, adults too have some time off and they are more inclined to go to a movie even if it is less hyped up, especially during Oscar season.
The bottom line is that in the winter – more movies battle for a pretty big cake, while in the summer, everyone is scared of the few bully-movies battling for an almost identical total cake. In winter you have a chance to get something even if you are not a heavyweight, but in the summer – you better stay out of the way of Iron Man and his buddies.
* Like this post? Follow me on twitter: @stavjdavis and/or like the Facebook page
The box-office segment of the film industry is relying more and more heavily on 3D screenings as its savior. This is how much:

While total box office appears to be steady (the blue line – not growing, but also not declining since 2005), the situation for 2D box office is bad, as the annual per capita spending on them has dropped from over $40/year to under $30/year – more than a 25% drop over the past decade (the original raw data of total nominal grosses and nominal 3D grosses, is from this MPAA report).
Now, you might claim that this is fair, since this is probably similar, for example, to the pattern that analog cameras followed as they were replaced by digital cameras. But here’s the thing: it is still unclear whether 3D is a superior product in the eyes of the consumer, especially since it is not expected to drive down the prices of the cinematic experience – unlike digital cameras or any other truly disruptive technology did in its respective domain. The problem with this industry-experiment is that by performing it, the industry is playing with fire: if 3D doesn’t hit an inflection point soon, there will be no way back to the old paradigm, because most 3D viewers will not agree to go back to 2D for the same price as 3D. Since 3D did not succeed in increasing the total number of tickets sold since 3D was introduced in 2006 (see previous post), in effect what it did was transform 2D moviegoers into 3D moviegoers with higher expectations.
The common perception of cinema has changed: cinemas have conquered the domain of 3D blockbusters, but while doing that they also surrendered the domain of 2D movies to home entertainment. All the people who left the cinematic experience behind over the past decade – be it for other forms of entertainment or for good home cinema systems – are not coming back for 2D cinema. In other words – if 3D fails, this industry experiment will end up proving to cannibalize the industry.
That being said, this may not be all bad, since revenues from home entertainment end up going to the studios and production companies anyway, but my point is that the following equation: “straight to home video” = less prestige, will have to change into: “straight to home video” = 2D. Therefore, independent production companies (which tend to make only 2D films) that adopt this new paradigm, will realize that there is hope for them. Those that stick to the current definitions of prestige, will have to cope with a lot of bleak projections.
* Like this post? Follow me on twitter: @stavjdavis and/or like the Facebook page
Judging Hollywood according to average ticket prices can be misleading. In PART 1, I pointed out that 2D box office data is mixed with 3D box office data. Here is another example of that:

All this graph shows is that since 3D films were re-introduced into our lives in 2006, there was an increase in ticket prices. As more and more 3D tickets have been sold since then (see the 3D vs. 2D grosses in my next post), the average was “pulled up” by the larger amount of premium 3D tickets.
One might claim that we don’t know much about the prices of 2D tickets, because we don’t know the amounts sold in each category. But here’s the thing: a report by analyst Richard Greenfield of Wall Street’s BTIG, which is quoted in this Deadline article, states that in 2011, the average ticket price for a 2D movie was $7.60 (vs. $10.85 for 3D). This means that 2D ticket prices have not gone down, in real terms, since 3D films were introduced in 2006.
So here’s what I’m thinking: Maybe it’s time to lower the prices of 2D films? (rather than using them to subsidize 3D premiums, which is what Regal is essentially doing by raising them to the price of 3D tickets). I’m not a pricing expert, but I will take the risk of saying that I think that the middle class of movies – the ones without the massive special effects – have a diminishing added value over modern home entertainment systems. They may still have some magic to them when projected on a big screen in a theater, but the evolution of home entertainment systems has made the delta considerably smaller – in both price and quality.
Perhaps it’s time to lower the prices of these movies, relative to the big spectacular 3D extravaganzas, because at the end of the day – a viewer’s decision if to pay $X for a movie is a binary one: they either do it or they don’t – and that acceptable price has been lowered. In the past, it used to be high enough to create the illusion of 2D and 3D film categories existing together – both valued above their price point. But now, the TRUE value of 2D movies has been reduced to below their current price point: the 2D cinematic experience costs more than the added value it provides over watching it at home. For an increasing number of people, the cost of a Netfilx account and a nice home theater system is less than the price they have to pay to watch a movie like The Iron Lady – which is excellent, but has no “urgency” factor or big-screen benefit to it. The Avengers, on the other hand, might not be as good creatively (arguable), but is probably worth the 3D ticket price, because recreating that experience at home currently costs much more than $10.85 per movie.
So if independent production companies (which are my focus in this blog) make primarily 2D films, and 2D ticket prices are not going down, and the value of 2D films is being eroded – indies have two options: either suck it up and ask for lower box office prices, or embrace the digital online streaming revolution and change the paradigm according to which a cinematic distribution is so much more prestigious than “straight to video”. This second option means that the industry will have to stop relying on box office as a promotion method for home entertainment revenue (DVDs, BluRay, rentals and streaming) and focus on direct marketing to those channels, while leaving the cinemas to be dominated by the giant studios. A diligent price sensitivity analysis, coupled with price elasticity research of these market segments will determine which of the two scenarios will prevail.
* Nominal figures from: National Association of Theater Owners.
** 2011 2D and 3D ticket prices are from this Deadline article, which quotes this report by analyst Richard Greenfield of Wall Street’s BTIG.
– Like this post? Follow me on twitter: @stavjdavis and/or like the Facebook page
If we take a look at the domestic number of tickets sold per capita, things don’t look too great for this segment of the film industry’s revenue stream. But with the data about 3D vs. 2D ticket prices being so fuzzy, I felt this needed a deeper look, to determine just how bad the situation is, or if it really is that bad. Let’s start with this deceptive graph:

*Data for number of tickets sold is from The-Numbers.com; U.S. Population from US Census
The average American went to the cinema a little more than 4 times in 2012. This is down from 5.49 a decade ago. That’s a 20.6% decline. But the problem with looking at this data as is, is that it mixes together 3D ticket sales with 2D ticket sales. And hiding variables like 2D sales behind the totals of 2D+3D in such a way is like a petri dish for funky business. I don’t have enough publicly available data to untangle this matrix completely, but the next two posts will be my best shot at separating 2D data from 3D data and substantiating a couple of theories about the real status of these two segments (spoiler: 2D is doing much worse than it seems, just like a kid that had his parents invest all their resources in his younger sibling – he will need some serious rehab…).
* Like this post? Follow me on twitter: @stavjdavis and/or like the Facebook page
An interesting trend in the movie business is the consolidation of cinemas. We all feel and see it and it’s obviously part of the larger trend of disappearance of the mom-and-pop shops. But here is how this specific trend took place historically:

* Raw data from the National Association of Theater Owners – natoonline.org
If we only look at the number of screens, we might wrongly conclude that the cinema-operating business is growing across the board – a mistake I almost made when I noticed the steady growth of the first-week distribution magnitude of domestic blockbuster releases. However, when you add the number of cinema sites, or cinema complexes – a fairly steep decline emerges: 26% fewer cinema sites in 16 years (7,744 in 1995 vs. 5,697 in 2011 – the red left axis).
When you couple this decline in cinema sites with the 29% increase in total number of screens in the U.S. (27,843 in 1995 vs. 39,580 in 2011 – the blue right axis) – the conclusion is clear: the industry is consolidating and converging into the distinct model of the mega cinemaplex. The average number of screens per cinema site has grown from 3.6 in 1995 to 6.95 in 2011 – that’s almost double. This means that the local one-screen neighborhood cinemas are being wiped out.
Why? My guess is that they are being squeezed from two directions by two parallel elements: First, Hollywood’s shift toward blockbusters that require repetitive parallel screening, especially during peak seasons, in order to fully capitalize on their financial potential. Second, improved home entertainment quality, which replaces the need for a cinema when it comes to smaller movies that don’t rely on special effects and the aura of the massive screening hall.
* Like this post? Follow me on twitter: @stavjdavis and/or like the Facebook page

Getting an Oscar nomination is good for actors’ and actresses’ careers, right? Well, yes, but as the following graphs show, it doesn’t necessarily increase box-office visibility in the years after the nomination, relative to the year of the nomination. Furthermore, it looks like the year following the nomination shows a significant drop in box office (especially for male actors – dropping by over 35%), before they fully capitalize on their boosted brand in the second year. This means that if you are a producer looking for a star, you should wait until the evening that Best Actor nominations are announced, pick up the phone and get those actors’ agents – because the following year is going to be one of peak brand strength for the actor, but also of low visibility of the actor, meaning you will have to deal with much less competition for viewer attention from other projects he/she is involved with. If you wait for the second or third year post-nomination, there will be an inflation of exposure of that star. Also, if you wait for the fourth year post-nomination – you’re back to low visibility, but that’s probably because the Oscar effect has worn out.
This graph is based on 100 Best Actor/Actress Academy Award nominations between the years 1998-2008 (50 males, 50 females), their average box office performance during the year of nomination (baseline = 100) and their box office performance 1, 2, 3, and 4 years post-nomination. There is definitely a pattern.
You could claim that without the nomination the shelf life of the talent’s career would have been shorter and that is a valid point that should be investigated further. But my point here is that an Oscar nomination for Best Actor/Actress is worth three more years of similar box-office visibility. Of course there are outliers (like Johnny Depp, who tried to screw up my pretty graph with crazy box office numbers), but on average, this is the situation.
Note: “Box office visibility” refers to the involvement of a talent in projects and how much they ended up being worth at the box-office. Indeed, this is not a highly accurate gauge, because it does not differentiate between lead roles and supporting roles, but when averaged over 100 stars, the above patterns emerged. Sure, Judi Dench was not the lead in the Bond movies she took part in after her Oscar nominations in 2001, 2005 and 2006, but the Bond box-office numbers are a relevant gauge of her exposure, because the truth is I remember her frowning as Bond’s Boss, much more vividly than as Mrs. Henderson, so I don’t think supporting roles should necessarily weigh less.
* Like this post? Follow me on twitter: @stavjdavis and/or like the Facebook page
Every industry has an ROI (Return On Investment) curve. So why not make one for film box office? I made a few histograms of ROI’s of different budget categories, based on the 2,349 films that have budget data and international box office data on The-Numbers.com. Here is a summary graph, followed by the detailed histograms:

And here are the histograms behind the above graph. First, this is the total industry picture, across all budgets:
 - budget range: 0-$300M")
And here is the breakdown of histograms for each budget category:
 - budget range: $100M-$300M")
 - budget range: $50M-$100M")
 - budget range: $20M-$50M")
 - budget range: $5M-$20M")
 - budget range: $1M-$5M")
And just for laughs, here is the histogram for the really tiny movies, whose data is not very reliable, as a large number of them are not reported and those that are reported are not very accurate. By the way, this does not include “Paranormal Activity”, because it’s ridiculous ROI of 15,000x screwed up everything…):
 - budget range: 0-$1M")
So: if you are a studio that can gather over $100M for your project, you are most likely not going to flop (sorry, John Carter of Mars). However, your returns will most likely not be more than 5x, which is actually not that bad when we are talking about these kind of numbers.
On the other hand, if you’re an indie producer, you better hope to all heavens that you know what you’re doing: the return can be astronomical, but the risk will usually not justify that. That being said, the low-budgeted market is probably swamped with amateurs and first-timers, who have no clue what they’re doing, so if I could only include the real professionals, perhaps the risk graph would be lower for this budget category.
Silicon Valley VC’s were the first to introduce the concept of a broad portfolio of micro investments, such as the Y-Combinator model. This is supposed to mitigate risk, but the question was, and still is – does that one bingo investment (think Paranormal Activity’s 15,000x ROI) really cover for the dozens of failed ones, tiny as they may be? I don’t know about hi-tech, but in Hollywood, it looks like the answer is yes: many micro investments in small projects should yield a higher total return. But since the bandwidth of one studio can only deal with a handful of projects at once, I understand why they tend to go for the lower risk mega-budgeted projects.
It makes me sad, but I understand it.
* Like this post? Follow me on twitter: @stavjdavis and/or like the Facebook page
Sadly, there are no graphs of my own in this post, only references to other people’s great resources.
In my last two posts I plotted pretty graphs that show a stagnation in domestic box-office and a crash in DVD sales. That was a pretty sad picture of the industry.
But it was only a partial picture. “Home entertainment” is not only DVDs. It’s BlueRay and it’s rentals and it’s video streaming services too.
The first two are most likely attached to the general crash in what the industry calls “packaged video goods”. Here is an eye opening article from the Wall Street Journal (need to subscribe to read), which quotes a report by the Digital Entertainment Group – you can get the exact numbers there, but the bottom line is that packaged video will not save the day. It’s streaming that is the new hope.
Online streaming services are the overlooked element of the industry and they seem to finally be hitting their inflection point. Here is a quote from a publicly available abstract of the original DEG report, which talks about Electronic Sell-Through (EST), which is a fancy nickname for Netflix, Amazon Prime, Hulu et al.:
“…Consumers also increasingly purchased their entertainment via EST. Consumer spending on EST climbed 35 percent compared to 2011. Total digital distribution spending, EST and VOD combined, grew 28 percent for the same period. Total digital now accounts for nearly 30 percent of the domestic home video market, up from 19 percent compared to 2011″
Be sure to take a look at this publicly available beautiful chart the WSJ has on their website. According to it, the growth in movie streaming has finally caught up with the crash in DVD sales. The result is the first increase in home entertainment sales since 2004 – stabilizing around $18B. An increase in home entertainment! That is huge news. While most people are obsessed with box-office, they forget about this huge portion of the film industry.
So. If we combine the stagnation in domestic box office shown in my previous post, with the crash in DVD sales shown in another post, it may seem like the industry is heading towards its end. But when we add to that the amazing rise of online movie streaming services, a glimmer of hope appears on the horizon.
The conclusion is that there are two ways for this industry to save itself:
- Embrace online streaming services as the new distributors: fighting Netflix is like mistaking a fire-fighter for a burglar and shooting him while he tries to tell you your house is burning around you.
- Get on the international sales wave, as shown in one of my previous posts.
* Like this post? Follow me on twitter: @stavjdavis and/or like the Facebook page
This post complements the previous one, which dealt with box-office stagnation. Before you get alarmed by the following graph – let me just say that there is better news right after it. I plotted this one using data from The-Numbers.com, which logs DVD sales. 
Image 1: DVD sales and revenue – 2007-2012 (data from The-Numbers.com)
.
The figures may vary depending on the different sources, but the trend is clear as daylight: DVD sales are crashing. When coupled with the box-office stagnation shown in my previous post, it may seem like the industry is on the fast track to its total collapse.
BUT!
DVD sales are not everything. There is BlueRay and there are rentals and there are streaming services. In my next post I will show that this is not the end of the world (hint: it’s the streaming services that will save the day). Stay tuned.
* Like this post? Follow me on twitter: @stavjdavis and/or like the Facebook page
This should probably have been my first post, because this is so basic: similar figures are probably on desktops all over Hollywood, but I wanted to create my own version of the box-office graph (will be complemented by my next post about the other significant segment of the film industry – home-entertainment):

Figure 1: Total Industry Domestic Box-office Grosses – 1990-2012 (Nominal and Real)
.
The most obvious thing is the stagnation in growth of industry box-office grosses, starting around 2002 – this part of the industry is in the same place it was over a decade ago. This is not a good sign. Of course, the other side of the equation is film budgets, which are extremely hard to estimate, but it is a dying industry’s practice to rely on decreasing costs rather than revenue growth: even if technology reduces the costs of production (and many people are telling me it’s not – it only pushed costs towards the post production phase, rather than the physical production phase) – there will always be a lower threshold on that, whereas revenue growth, theoretically has no limit. When comparing this stagnation to the growing GDP in the US, the only conclusion is that people are shifting their budgets away from the cinematic experience.
That being said – the industry is not dying. Not yet. It’s in the same place the music industry was 15 years ago and the television industry was 5 years ago. It still has enough life and energy (and money) in it to find the new model for engaging the end user. For music that was direct single-track online sales, as well as the return of the live show as the tent-pole of an artist’s career. For TV that was direct TV on demand and the Netflix/Amazon model. At first, it looked like badass 3D cinemas with Dolby Surround and comfy seats would be enough. But apparently it did nothing more than buy the industry a few more years of watching it’s ugly TV sister grow into the healthier version of the business.
But what about the other part of the industry – home entertainment sales, you may ask? Surprising findings on that front – all in the next post – THE BASICS 2: SO WHAT’S UP WITH DVD SALES?
* Like this post? Follow me on twitter: @stavjdavis and/or like the Facebook page
In my previous post I showed that domestic box office results have been shifting considerably towards the opening weekend. Here is the graph, as a reminder:

Figure 1: Opening Weekend Grosses as % of Total Domestic Grosses – 1990-2012 (top 100 releases for each year)
.
So far so good. But then I asked the question – which of the following three parallel potential explanations is the dominant one: 1. Easier spread of word of mouth due to internet penetration. 2. Marketing teams deliberately pressuring audiences into watching a movie upon its release. 3. The increased prevalence of “event releases” for existing established brands.
To answer this question, I produced the following graphs:

Figure 2: Opening Weekend Grosses as % of Total Domestic Grosses – 1990-2012: Top 100 vs. Top 40 vs. Bottom 20 (=Ranked 81-100 for each given year)
.
This figure shows that the less successful movies (ranked 81-100 for each year – the green line) have not been affected by the general box office trend of shifting towards the opening weekend. Their second week drop has remained in the 25%-30% range for the past two decades (compared to the huge increase in Top 100 second week drop off – from 16% to over 30%).
My conclusion from this is that with all due respect to the romantic perception that the freedom of information that the internet represents is there to help the customer – is wrong in this case. According do Figure 2, reasons 2 and 3 seem to be more dominant: if we assume that the less successful films typically have a smaller budget, and more specifically a smaller marketing budget, this would mean that these budgets are responsible for the trend. Since the trend is so much stronger for movies with higher marketing budgets, the conclusion is that marketing teams are responsible for herding us to sparkling premiers. Once we realize the movie’s true quality, it’s too late.
If reason 1 (easier word-of-mouth) were the winner, that would mean that we are hypothesizing that the less successful movies made less money because they were simply not as good. A previous post on this blog, shows that this relationship is a very weak one, but let’s play along: in that scenario, we would expect the effect of easier word of mouth to make these movies crash even faster as internet penetration rates rise over the years, but this is not the case.
Therefore – kudos to marketing teams for using the internet well.
However, we are still in the early days of this trend. The question is – will an increasing number of people just wait for the second week, like I do, in order to hear what the general reviews are on the web, before they spend money on it? That could reverse the trend. And if that happens, the studios’ response will most likely be to bombard us with even more fan-based franchises, where the first viewers get fame and glory in their fan-communities.
Of course, another option would be to just make really good movies that will benefit from positive word-of-mouth, but at present – that still costs more than getting fanboys to stand in line in the cold for a special midnight premier.
* Like this post? Follow me on twitter: @stavjdavis and/or like the Facebook page
Everyone is telling me that movie box office efforts are shifting more and more heavily towards the first week. So I wanted to see if that perception is true. Here is what I found (click on the image to actually see something):
Figure 1: Opening Weekend Grosses as % of Total Domestic Grosses – 1990-2012 (top 100 releases for each year)
.
So the answer is yes – it’s true, box office has been shifting considerably towards the opening week (16% of total gross in 1990 vs. 30% in 2012). Another way to phrase this is: The second week drop in box office has almost doubled over the past two decades.
The way I see it, there are three possible explanations for this:
1. The penetration of the internet into US households, makes word-of-mouth easier to spread. Consequently, more films burn out quicker than they used to when bad movies could hide behind the smoke screen of difficult access to unbiased reviews.
2. Marketing teams learned how to deliberately get viewers to watch a movie before this word-of-mouth catches up with their advertising.
3. “Event releases” are becoming more popular because they are easier and cheaper to hype up and pressure fans into being the first to watch. Batman, Spiderman, Hunger Games, Twilight, Harry Potter, The Hobbit, etc. – all have pre-existing fanatic fan communities that rank their members by the amount of time they spend in the cold, waiting for a midnight premier.
The easy thing to do would be to conclude that it is a combination of these three. But I never liked easy, which is why I was drawn to this hopeless industry in the first place. 🙂 Therefore, my next post will try to isolate the exact cause of this trend (I hope. I haven’t run the numbers yet).
* Like this post? Follow me on twitter: @stavjdavis and/or like the Facebook page
The ultimate question: Does viewer satisfaction drive box office results? Or perhaps it’s the other way around and box-office results drive the perception of quality? Are the two parameters related at all?
Here is a plot of the box office numbers vs. their Rotten Tomatoes scores (critics’ scores – figure 1; users scores – figure 2), for the 81 new movie releases from 2012 that were made with a budget of $30M – $200M and were released at more than 2000 screens:

Figure 1: Domestic Box-Office vs. Rotten Tomatoes critics’ scores for 2012 new releases reaching 2000+ screens
.
 scores")
Figure 2: Domestic Box-Office vs. Rotten Tomatoes users’ scores for 2012 new releases reaching 2000+ screens
.
The main point of these graphs is that they are pointless: it is obvious to the naked eye that there is no linear relationship here. (If you insist on scientific name-dropping, the r^2 values of the graphs are: 0.097 and 0.146, respectively – pretty miserable results). In other words: there is a very weak connection between a film’s quality and its box-office result for both critics and mass viewers (it might look like the scores are slightly higher for higher box-office, but the spread is just too huge to make that significant).
The conclusion I draw from these plots is that Hollywood’s marketing teams are very effective at the wrong kind of marketing. Something is causing people to watch bad movies just as much as they watch good movies. Sure, some films are niche productions and that may be true about a handful of them (like Moonrise Kingdom), but in general – all the films shown here have expanded their release to more than 2000 screens nationwide and therefore are not exactly tiny art-house productions.
And that is one of the core problems with Hollywood: if a studio has a mediocre movie and a free dollar, it would rather invest that dollar in superficial crowd-drawing elements like star-power or more P&A, rather than in improving the movie’s value proposition itself. This is not just an ideological problem – in the long run, it will cause viewers to lose trust in movies versus other forms of entertainment. Once viewers get burned a certain number of times by movies they pay for and don’t enjoy – they will shift an increasing percentage of their entertainment budget to more “honest” formats – be it Netflix/Amazon style recommendation services or other forms of entertainment altogether. These formats deliver what they promise more accurately. While I can usually return a product if it doesn’t work out for me, I can’t get my time and money back for a bad movie. Therefore, the manipulation of customers here is of much higher stakes, to the viewer – in the short run, but also to the industry – in the long run. And it could be devastating for the latter.
When the film “Taken 2” gets a Rotten tomatoes score of 55 from users and 21 from critics, while bringing in a nice $139.8M – it not only causes viewers to abandon the franchise. It also causes them to lose just a little more of the trust they place in the cinematic experience as a good value for their money (sure there are opposite examples, but there are much more examples than counter examples). One might claim that some movies did better because of “smart distribution” or just plain luck (like opening on an easy weekend), but that does not change the fact that people are starting to feel they have better ways to spend their time and money than at cinemas, which are disappointing them more and more often lately, with false expectations. Why would you stick to movies at the cinema for $13 a pop, when you have Netflix, Amazon, Xbox, Playstation, iTunes, Zynga or even the option to have a good old fashioned walk in the park?
The studios’ enemy is not rival studios or independent production companies. Their enemy is rival industries. If they keep investing only in manipulative marketing gimmicks and not in actual quality, originality and innovation, they will drag the whole industry down with them. Good strategic marketing is ultimately about getting more right products to the right customers. Not just selling more of whatever you’ve got.
* Like this post? Follow me on twitter: @stavjdavis and/or like the Facebook page
This post was updated on March 20, 2014. It’s so much better now.
It was also featured in the Washington Post “40 Charts that Explain the World” (#38 on the list)
Here is an interesting look at worldwide box-office grosses by territory over the past 12 years. A few interesting trends emerge:

Notice the steady decline in English speaking territories and the US in particular, as well as the more recent decline in the Western European market share. Compare that to the growth in Asian markets (despite a crash in Japan’s market share) and China in particular. Eastern Europe is also an awakening territory, as is Latin America (led by Brazil), which more than doubled its share over the past decade. Not in this chart, but worth mentioning: the Middle East is also starting to show signs of substantial box-office presence.
One explanation for these trends is saturation of the developed film markets. Another is the general rapid economic growth of the developing markets. A third theory is internet penetration rates across the world, which make marketing much easier. We can conduct that debate sometime, but the bottom line is that with the US market shifting more and more towards massive tent-pole studio productions, the best chance for indie films to survive is by targeting international markets.
The large-budgeted monsters are hogging an increasing portion of the 150-200 annual nationwide release slots in the US. But the growing international territories mentioned above still have demand for Cinematic entertainment with only partial fulfillment. They have not yet been swamped by Iron Man and his pals. Just like in high-tech, this is where the small players’ agility can finally triumph over the sluggish giants. The blockbusters are starting to discover these markets, which is what these graphs show – but there is still plenty of meat to go around, if the small players move quickly.
This theory has many caveats, of course: do developing markets even want American movies that are not blockbusters? Can a movie succeed in foreign markets without relying on buzz of success in the US (check out this post on that matter)? Can small production companies deal with the blood-red legal waters of distribution in some of these markets? I believe the answers to these and other questions are yes. But I’m always an optimist when it comes to entrepreneurship. What do you think?
How was this done?
The top 100 domestic grossers of each year were tracked (1,200 films total) for 2002-2013 and the box office grosses for each country available on boxofficemojo.com was extracted using a python script and grouped into territories.
* Like this post? Follow me on twitter: @stavjdavis and/or like the Facebook page
